Inactive Learning?
I totally stole the title from a paper (Attenberg & Provost, 2011).
In theory, Active Learning (AL) is a tremendous idea. You need labeled data, but your kind of labeling comes at a cost, e.g., you need to obtain them from a domain expert. Now, lets say, your goal is to use this labeled data to train a classifier that gets to a held-out accuracy of \(90\%\). If you randomly sampled points to label, you might require \(1000\) points. Active Learning lets you strategically pick just \(500\) points for labeling, to reach the same accuracy. Half the labeling cost for the same outcome. This is great!
Except that in a lot of real-world cases this is not how it plays out. I suspected this from my personal experiments, and then in some stuff we did at [24]7.ai. So we decided to thoroughly test out multiple scenarios in text classification, where you believe (or current literature leads us to believe) Active Learning should work … but it just doesn’t. We summarized our observations into the paper “On the Fragility of Active Learners for Text Classification” (Ghose & Nguyen, 2024) [PDF], and that is what I’d refer to you for details. This post is part overview and part thoughts not in the paper. Here’s the layout:
What do we expect to see?
OK, just for an idea, what would be an example of an AL technique? Let’s look at one of the earliest ones: Uncertainty Sampling (Lewis & Gale, 1994). Here you pick points to be labeled in batches. You kick-off with a random batch (also known as the “seed” set), label them and train a classifier. Next, you use this classifier to predict labels of the unlabeled points. You note the confidence of each prediction, and pick the points for which the confidences were the lowest, or equivalently, the uncertainty was the greatest. This is the batch you now label. Rinse and repeat. We’ll often refer to an AL technique by its other moniker, a Query Strategy (QS), which comes from the fact that it is used to query points for labeling.
The idea is that by supplying to the classifier the points it is most wrong about, you force it to improve faster. This view has problems, and we’ll get to it in a while. But if it worked - if any AL technique worked - here’s what we would expect to see:
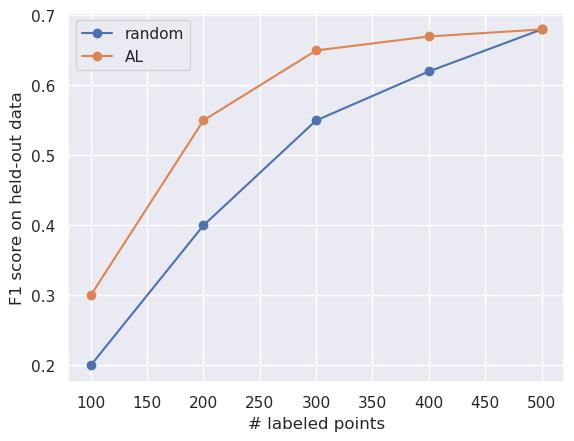
All AL curves, in an ideal world.
The F1-scores on the y-axis are reported over a held-out set, i.e., a test set with labels. This is not available in a real-world setting; because if you had labels for a significantly large test dataset, in a world where labeling is expensive you will use it (or part of it) for training, thus negating the need for using AL. The batch size in the plot’s setup is \(100\) (which is not very important here - its just indicative).
Note that:
- The initial accuracies are identical - or in practice, quite similar. This is because the seed set is typically randomly picked (true in this illustration).
- As labeled data increases, both curves converge to the same accuracy (or similar accuracies in practice). This is bound to happen since beyond a critical mass of points (collected via AL or randomly) the classifier has seen all patterns in the data, and will be able to generalize well.
What do we see?
A learning setup can vary wrt multiple things: the dataset, the classifier family (something traditional like Random Forests vs a recent one like RoBERTa) and the text representation (so many embeddings to pick from, e.g., MPNet, USE). You’re thrown into such a setup, and you have no labeled data, but you have read about this cool new AL technique - would you expect it to work?
This is the aspect of AL that we explored. The figure below - taken from the paper - shows the cross-product of the different factors we tested. In all, there are \(350\) experiment settings. Note that RoBERTa is an end-to-end model, so in its case, both the “Representation” and “Classifier” are identical. Not counting random sampling, we tested out \(4\) query strategies (right-most box below), some traditional (“Margin” is a form of Uncertainty Sampling), some new.
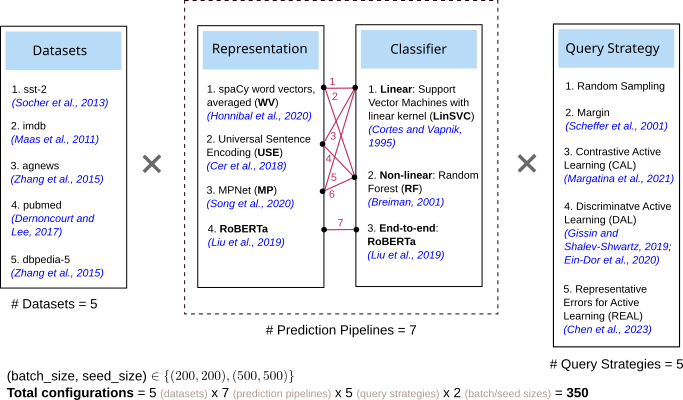
Factors that were varied in our experiments. Figure 1 in the paper.
And below are the results we observe. Each row is a classifier+representation combination. There are 5 heatmaps each corresponding to the number of labeled points, e.g., \(1000, 2000, ..., 5000\). Within a heatmap, each column represents a query strategy. Each cell shows the percentage relative improvement of a non-random query strategy over random sampling (this is why we have only \(4\) columns in each heatmap). The acronyms are declared in the previous image. The results are averaged over multiple datasets and trials.
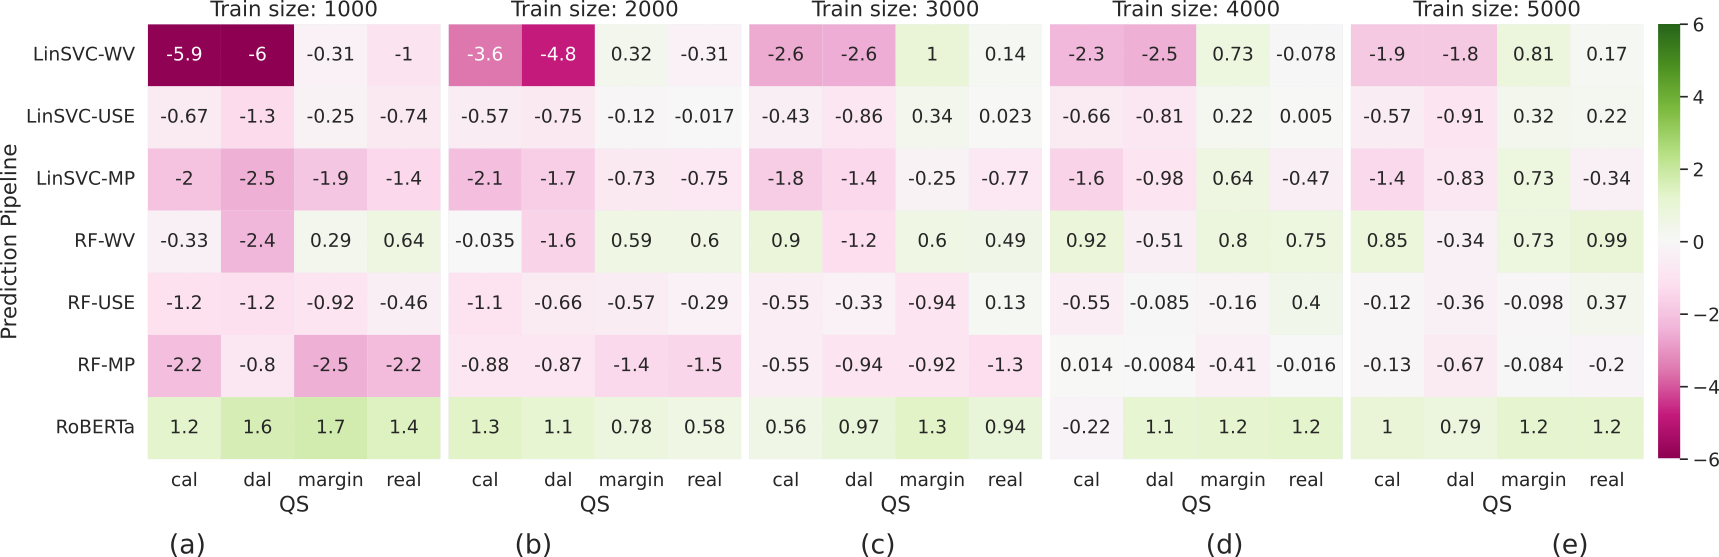
Observations. Figure 3 in the paper.
Here are the key takeaways:
- A lot of the percentage relative improvements are negative.
- As the number of labeled points increase, they tend towards positive. But remember that having a lot of data - even randomly picked - is bound to increase classifier performance anyway; so even for the positive-improvement cases the relative improvements over random are quite small.
- Different setups seem to also have different “warm-up” times, i.e., the number of labeled examples at which the transition from red to green improvement occurs. There is no way to predict these warm-up times by looking at the setup; so you get what you get.
- RoBERTa seems to register positive improvements for most setups, but this is not a high number; its close to \(1\%\).
In short, at low labeled-data regimes, AL does poorly; this is unfortunate, since this is when you want AL to actually work. AL has diminished utility at larger data regimes, because the performance of random sampling also improves just because we have more data. And we see that in the plot above: at high labeled-data regimes, when the relative improvements are positive they are low. If I were to distill these trends as a line plot, I’d say the average behavior of AL seems closer to this:
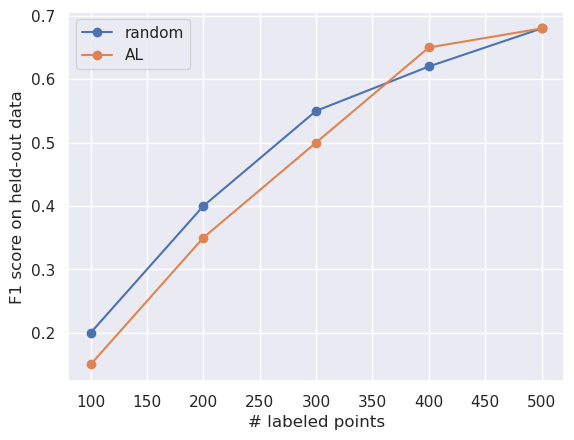
The average behavior of AL we see empirically.
Here be Dragons
So why the discrepancy between theory and practice? Let’s start by appreciating that AL is a particularly hard problem. Consider what you are up against: you are trying to build a supervised model while you are soliciting the supervision, i.e., labels. You will only know you were right or wrong about your pick of the AL technique after you have labeled enough data (because you can then simulate random sampling and see how much its trajectory is better or worse). But this is too late because your labeling budget is already expended. AL problems are unforgiving because you need to get it right in one-shot; using a classifier and representation that is likely different from what was used in reporting the original results, on a dataset that was definitely not used (if its a problem you’re solving in the industry) by the original literature. The AL problem is a model transferability problem in disguise.
To give you an example of the challenges, let’s revisit Uncertainty Sampling and consider a toy problem (this is from (Dasgupta & Hsu, 2008), and the figures are from my PhD thesis). In the figure below, we have a one-dimensional dataset (shown on a line, with the rectangles showing their density) with two labels, red and green. Note the distribution - two big chunks P and Q, and some smaller chunks. Our goal is to learn a classifier, which here is essentially a point on the number line, and the classification logic is that all data to its left will be classified as “green”, and data to its right would be classified as “red”.
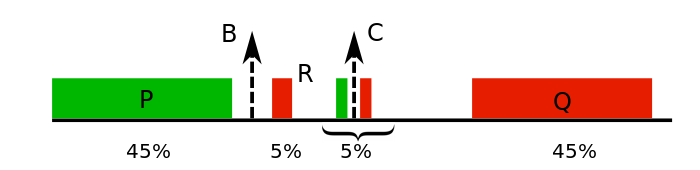
1D toy dataset, where the distribution is shown with rectangles.
What’s the location of the best classifier? Its location B: the only misclassified points are in the thin green slice of points towards its right. That slice has a width of \(2.5\%\), so that’s the best classification error in this setup.
Now consider the AL setting where we don’t have any label information. In the first iteration, we randomly sample a batch of points. Its highly likely that we would end up sampling points from the larger chunks P and Q. So we get them labeled, and learn a classifier, which is going to be near C - right at the middle, with the good stuff like maximized margins. Now we compute the uncertainty values for all points. The plot below shows these values.
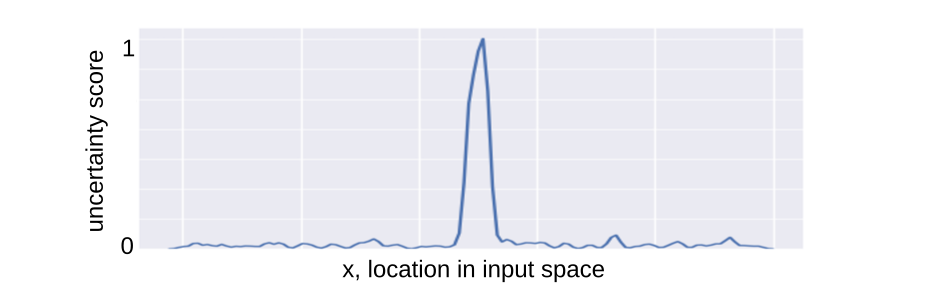
Uncertainty scores of predictions on the input space.
The greatest uncertainty is right in the middle of P and Q, since this represents the classifier’s boundary. In the next iteration, we sample points around C. The slim chunks of points around C match what the classifier has already seen, and it cannot know (with this sampling strategy) that there is a small red chunk, with width \(5\%\) a little further out to its left. So the classification boundary doesn’t change, and C’s uncertainty view is reinforced in future iterations, leading to cascaded sampling bias. Classifier C has an error of \(5\%\).
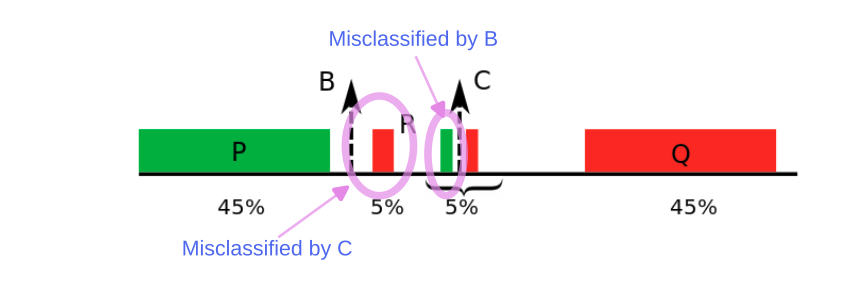
Error regions for each classifier.
Now, this is a contrived example, and you can argue you can come up with a better heuristic to deal with this specific case (these are precisely the kind of problems AL research tries to address)- but the larger point is that there is going to be this pesky issue of dealing with unknowns: the dataset, classifier, representation, etc.
There is obviously a lot to say on this topic, but I’ll try to summarize my thoughts below:
- AL is unforgiving because you see results reported from one setup, and based on that you hope it will work for your setup. And you have one-shot to get it right. We need ways to scientifically evaluate similarity in setups or applicability of a technique to a new setup - these are lacking in the area today.
- The focal point of much of AL research has been the query strategy, but our experiments (and there have been others before us, including the paper whose title we have re-used) tell us it is sensitive to other factors in non-trivial ways. We think that there needs to be much broader discourse around what specific problems AL should be attacking. Hint: it can’t be an isolated view of the query strategy alone.
- We need better benchmarking. When we went around looking for benchmarking codes or AL libraries, often we found that:
- There is no model selection performed on the classifier that is learned in every iteration. Library defaults get used. Future researchers, there is nothing magical about
C=1in scikit’s LinearSVC! Fitting on an arbitrary hyperparam value makes already shaky results even more shaky. It provides no reference frame, and with a different dataset etc, there is a greater chance that the gains you see will vanish. - Same goes for model calibration. Some query strategies rely on good probability estimates for the classifier’s predictions, and for that classifier needs to be properly calibrated.
- There is no model selection performed on the classifier that is learned in every iteration. Library defaults get used. Future researchers, there is nothing magical about
- Related to the above point: I have heard arguments along the lines that performing model selection or calibration is time-consuming. First, that should not be an excuse to report volatile numbers. Second, we can’t solve problems we are not aware of, and if selection/calibration is a deal-breaker for AL research, let’s let that be widely known so that someone out there might take a crack at it. Maybe that will renew focus on efforts like the Swiss Army Infinitesimal Jacknife (Giordano et al., 2019).
-
Some AL algorithms have fine-tunable hyperparameters. These are impossible to use in practice. We are in a setup where labeled data is non-existent - what are these hyperparams supposed to be fine-tuned against? And remember that at each iteration you’re picking one batch of points, which implies the hyperparams are held fixed to some values at the iteration; so, over how many iterations should this fine-tuning occur, and how do we stabilize this process given the number of labeled data points at iterations differ? These questions are typically not addressed in the literature.
AL hyperparams are like existence proofs in mathematics - “we know for some value of these hyperparams our algorithm knocks it out of the park!” - as opposed to constructive proofs - “Ah! But we don’t know how to get to that value…”.
- Lack of experiment standards: its hard to compare AL techniques across papers because there is no standard for setting batch or seed sizes or even the labeling budget (the final number of labeled points). These wildly vary in the literature (for an idea, take a look at Table 4 in the paper), and sadly, they heavily influence performance.
- This caveat is for readers of AL literature. Be careful in interpreting reported results, especially the Wilcoxon signed-rank statistical test. In AL, this is used to compare the held-out accuracies between a query strategy and random (or another query strategy) at various labeled-data sizes. You would want a small p-value, but that doesn’t tell you by how much a query strategy is better. Look at the legend in the plot below. Both strategies QS1 and QS2, when compared to random, lead to the same p-value. But you probably want QS2.
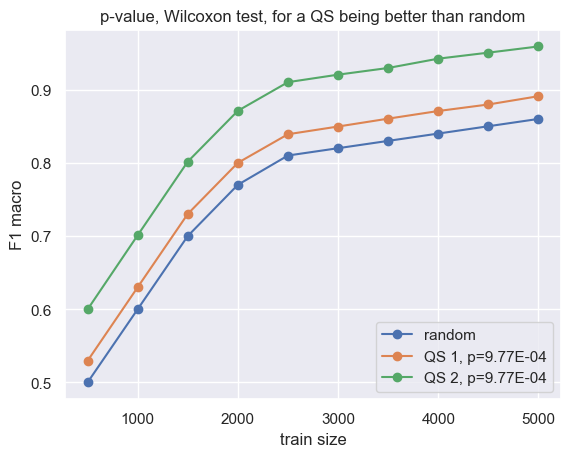
Different query strategies might lead to identical p-values on the Wilcoxon test.
I hope this post doesn’t convey the impression that I hate AL. But yes, it can be frustrating :-) I still think its a worthy problem, and I often read papers from the area. In fact, we have an ICML workshop paper involving AL from earlier (Nguyen & Ghose, 2023). All we are saying is that it is time to scrutinize the various practical aspects of AL. Our paper is accompanied by the release of the library ALchemist (still polishing up things) - which will hopefully make good benchmarking convenient.
Acknowledgements
A lot of this research unfolded - sometimes at a glacial pace - over time. During that time, my co-author Emma T. Nguyen and I greatly benefited from inputs from Sashank Gummuluri, Joshua Selinger and Mandar Mutalikdesai.
References
- Attenberg, J., & Provost, F. (2011). Inactive Learning? Difficulties Employing Active Learning in Practice. 12(2), 36–41. https://doi.org/10.1145/1964897.1964906
- Ghose, A., & Nguyen, E. T. (2024). On the Fragility of Active Learners for Text Classification. The 2024 Conference on Empirical Methods in Natural Language Processing. https://arxiv.org/abs/2403.15744
- Lewis, D. D., & Gale, W. A. (1994). A Sequential Algorithm for Training Text Classifiers. Proceedings of the 17th Annual International ACM SIGIR Conference on Research and Development in Information Retrieval, 3–12. http://dl.acm.org/citation.cfm?id=188490.188495
- Dasgupta, S., & Hsu, D. (2008). Hierarchical sampling for active learning. Proceedings of the 25th International Conference on Machine Learning, 208–215. https://doi.org/10.1145/1390156.1390183
- Giordano, R., Stephenson, W., Liu, R., Jordan, M., & Broderick, T. (2019). A Swiss Army Infinitesimal Jackknife. In K. Chaudhuri & M. Sugiyama (Eds.), Proceedings of the Twenty-Second International Conference on Artificial Intelligence and Statistics (Vol. 89, pp. 1139–1147). PMLR. https://proceedings.mlr.press/v89/giordano19a.html
- Nguyen, E. T., & Ghose, A. (2023). Are Good Explainers Secretly Human-in-the-Loop Active Learners? AI&HCI Workshop at the 40th International Conference on Machine Learning,
ICML. https://arxiv.org/abs/2306.13935